Challenges of Data Ingestion—and How Industrial Edge Solutions Help
Editor’s Note: This blog is a continuation of our industrial edge blog series. In our first blog, we discussed IIoT and the value of collecting data. In the second blog, we discussed industrial edge solutions. In this blog, we examine how industrial edge solutions can be applied to specific use cases.
Now more than ever—as material shortages, supply chain issues and talent gaps dominate the industrial world—manufacturers need to utilize the power of data to improve operations and reach their production goals. While data is key to making these improvements, it’s challenging to successfully move information from multiple sources to one specific place so it can be processed and analyzed.
A solid data ingestion process helps you effectively connect a wide variety of data structures to where they need to be—making sure the data is harmonized, in the correct format and has the same level of quality.
Data Ingestion to Calculate OEE
OEE (overall equipment efficiency) is a popular KPI (key performance indicator) used in manufacturing environments. It measures how well a plant runs.
For example: An OEE score of 50% means your operations are running at half their theoretical optimal performance. An OEE score of 100% means you have perfect production: All manufactured parts are of good quality, they’re manufactured as quickly as possible and there is no downtime. For discrete manufacturers, the average OEE is 60%—and this number indicates room for substantial improvement.
According to author Robert Hansen’s book, Overall Equipment Effectiveness, “A 10% improvement in OEE can result in a 50% improvement in ROA (return on assets), with OEE initiatives generally 10 times more cost effective than purchasing additional equipment.”
3 Variables You Need to Determine OEE
The challenge in determining OEE comes down to collecting the right data from disparate data sources—and that’s where data ingestion comes into play. It helps critical data from IT and OT data sources get to the right places.
- OT data sources come from the operational technology on the plant floor outside the realm of traditional IT. Examples of OT data sources can include PLCs (programmable logic controllers), BASs (building automation systems) and industrial sensors.
- IT data sources are typically on-premises or cloud applications that contain information related to operations. Examples of IT data sources can include an MES (manufacturing execution system), QMS (quality management system), ERP (enterprise resource planning) system and CMMS (computerized maintenance management system).
Data from OT and IT data sources are used to calculate the three factors that make up OEE. Let’s take a look at each one.
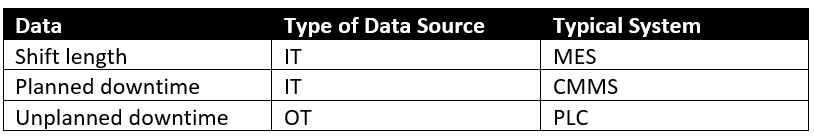
1. Plant Availability

The data you need to calculate plant availability includes:
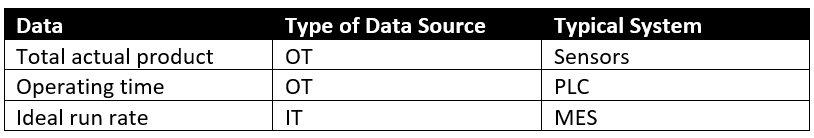
2. Plant Performance

Performance represents the ability of a manufacturing process to run at maximum possible speed. It takes performance loss into account, which includes any factor that causes production to operate slower than the maximum possible speed.
The data you need to calculate plant performance includes:
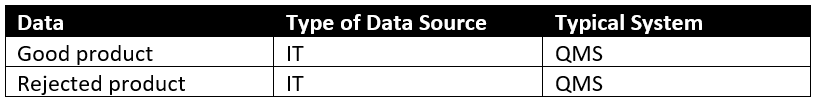
3. Quality

The data you need to calculate quality includes:
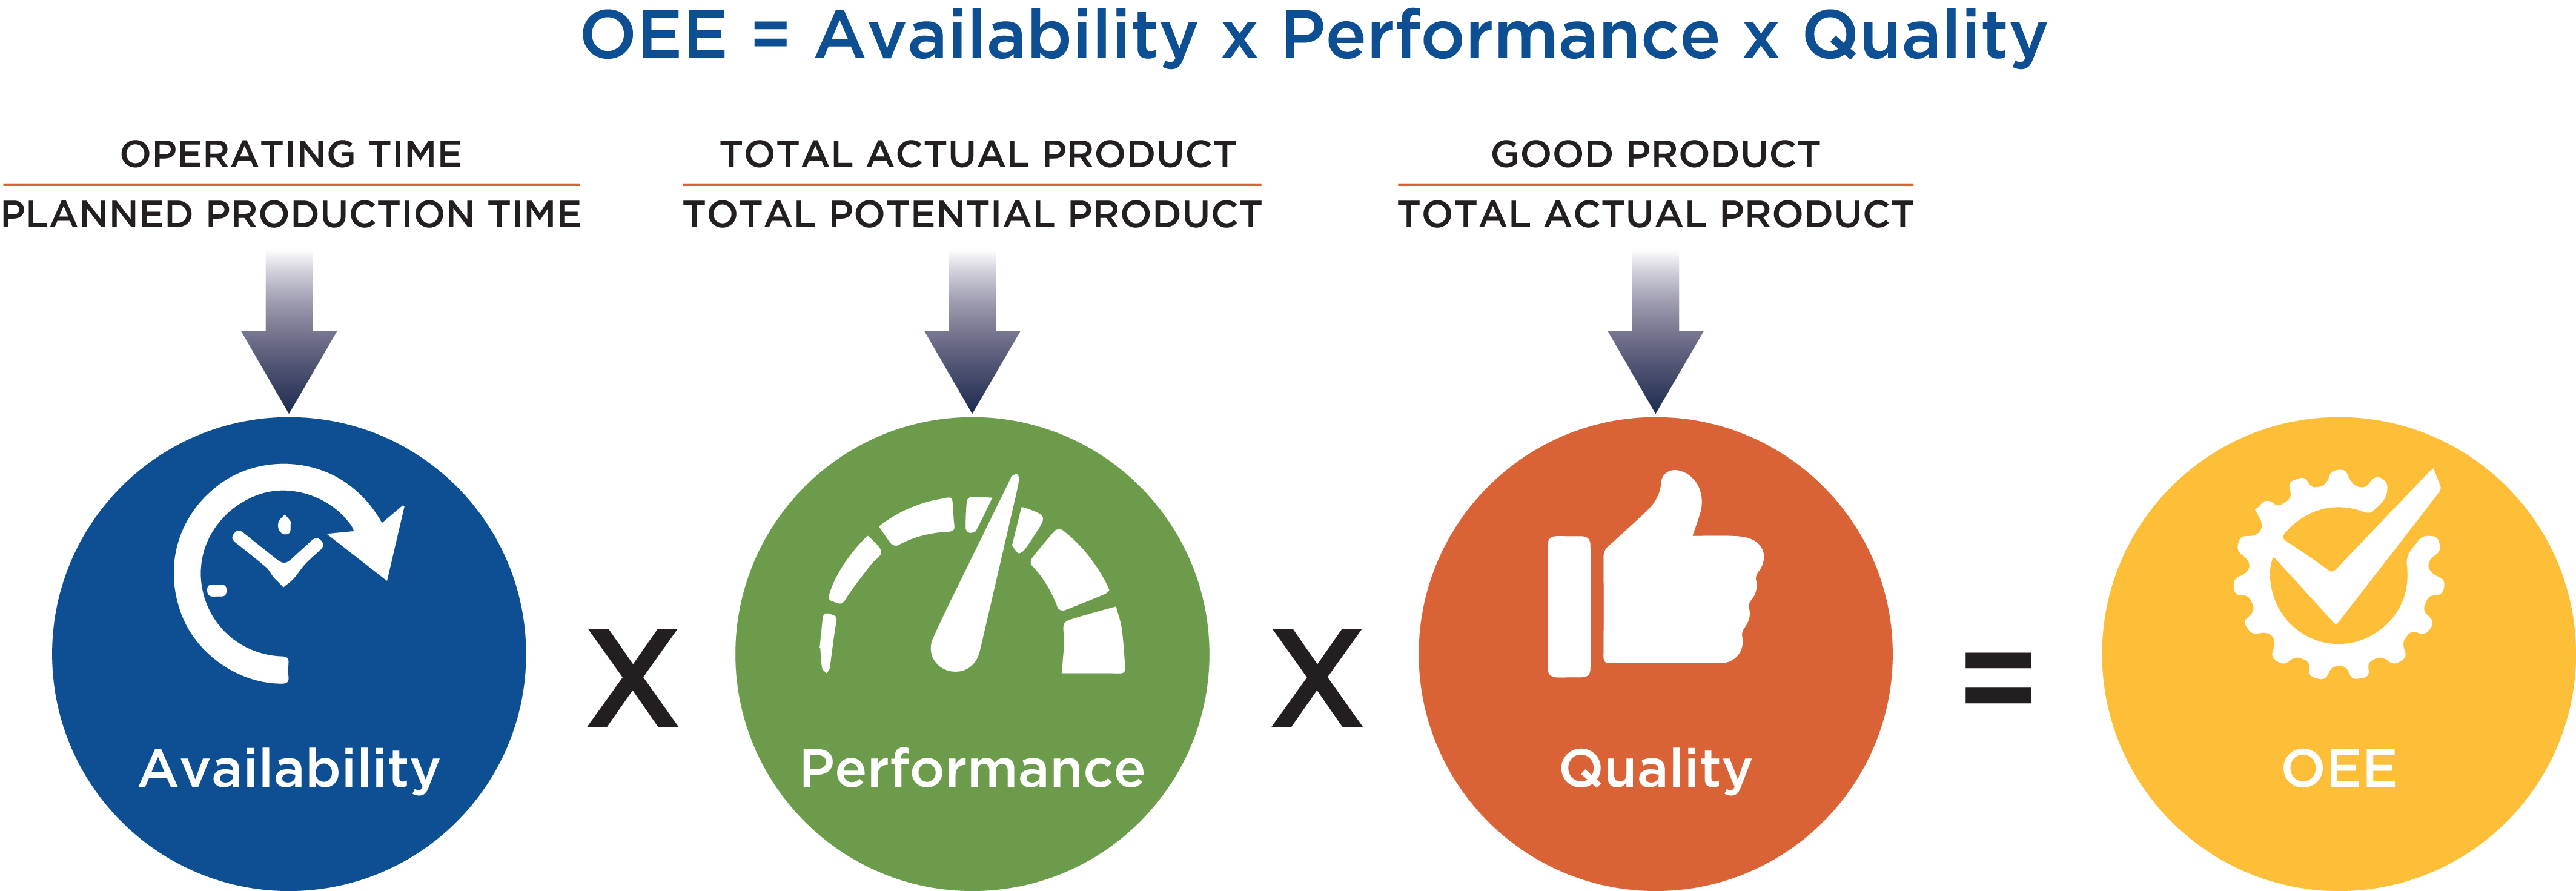
Once you have these three values—availability, performance and quality—you can determine your OEE using this formula:
3-Step Data Ingestion Process to Calculate OEE and Other KPIs
We all know the adage, “If you cannot measure it, you cannot improve it,” made famous by Lord Kelvin (a.k.a. William Thompson). Because data ingestion is necessary before you can measure, a modern revision of the quote could be: “If you cannot securely and reliably ingest data, you cannot measure it—and, if you cannot measure it, you cannot improve it.”
Luckily, today’s data ingestion processes are much more cost effective and scalable than they were in Lord Kelvin’s day. Following this three-step process will help you successfully move information from multiple sources to one or many destinations so it can be processed and analyzed.
-
Connect Your Data
To connect your data, you need an infrastructure that supports the digitization of processes and connects various data sources to the network through components like cables (copper and fiber) and networking gear (switches, routers, edge gateways, etc.).
-
Collect Your Data
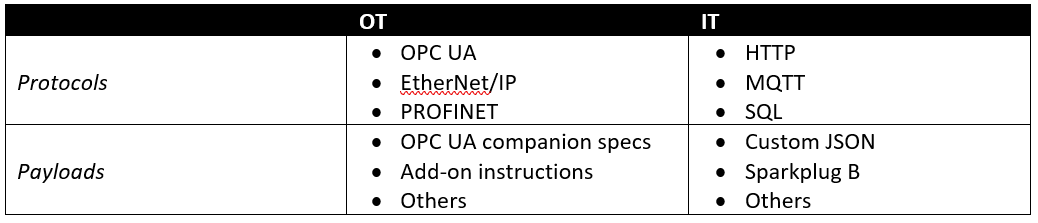
Once your data is connected, you need to be able to collect it. This process involves ingesting and transforming data from various protocols and manipulating payloads within the protocols so they can be collated with other data sources.
This table represents examples of different protocols and payloads involved with IT and OT data.
-
Collate Your Data
Collating your data means combining IT and OT data sources to fit the format required by the application(s) that will consume the information.
IoT platforms like Azure IoT or AWS IoT, analytics tools like Oden Technologies and modern SCADA applications like Inductive Automation’s Ignition platform can be used to visualize OEE data.
Although each platform supports REST and MQTT protocols, each platform also requires the data to have a slightly different payload structure. The ingested data needs to be collated into the expected format before it can be consumed by these applications. Tools like Node-RED are often used to do this at the edge of industrial networks.
Once this raw data has been collated into a useful format, it can then be consumed by whatever downstream application is used to visualize OEE information for executives.
How Belden Helps with Data Ingestion
- Our team of experts can show you how Belden’s industrial edge solutions support data ingestion so you can calculate OEE and take steps to improve plant processes.
- Our industrial edge solutions help you carry out the three-step data ingestion process. Connect your data with a wide variety of cabling, networking equipment and protocol converters. Then, collect and collate your data with industrial edge gateways that support containerized protocol conversion, payload transformation and data collation applications.
- Later this year, Belden will launch a series of robust industrial edge gateways and orchestration capabilities to provide your industrial operations with secure, flexible and scalable edge compute functionality. Stay tuned to our blog to learn more.
Contact us to learn more and to stay on top of industrial automation trends.
Belden's Technical Edge Product Manager, Matt Wopata, helped me write this blog, and he is a tremendous resource who can address any of your data ingestion questions. If you want to know more about this topic, email me (Jeremy.Friedmar@belden.com) or Matt (Matthew.Wopata@belden.com).
About the Author
![System.String[]](https://assets.belden.com/transform/55ed19c6-b6a3-4932-a9b4-82f70a76ce20/Jeremy-Friedmar-Headshot?io=transform:fill,width:300,height:300)
Jeremy Friedmar is the Director of Product Manager for Industrial Edge Solutions at Belden. In his current role, Jeremy leads the business and product strategies for Industrial Edge Solutions in the converged IT/OT automation space. During his 14-year tenure at Belden, Jeremy has held a variety of positions in product management and channel management representing the Smart Buildings, Industrial Cable Solutions, and Industrial Networking Solutions business units. Jeremy has a Bachelor of Science & Engineering degree in Materials Science & Engineering and Bachelor of Arts degree in Communication from the University of Pennsylvania, as well as, a Master of Business Administration degree from the University of Maryland.